Project scheduling at UGent - A case study (10/13)
The Mutum Paraná II bridge, Case B
On Wednesday, November 30, 2013, 280 students had to solve the Mutum Paraná II bridge case study (part B) as part of the course “Project Management” at the faculty of Economics and Business Administration of Ghent University. The aim was to analyse project data and to present the results to the project team of the company in a written report. Below you find some key metrics of their analyses:
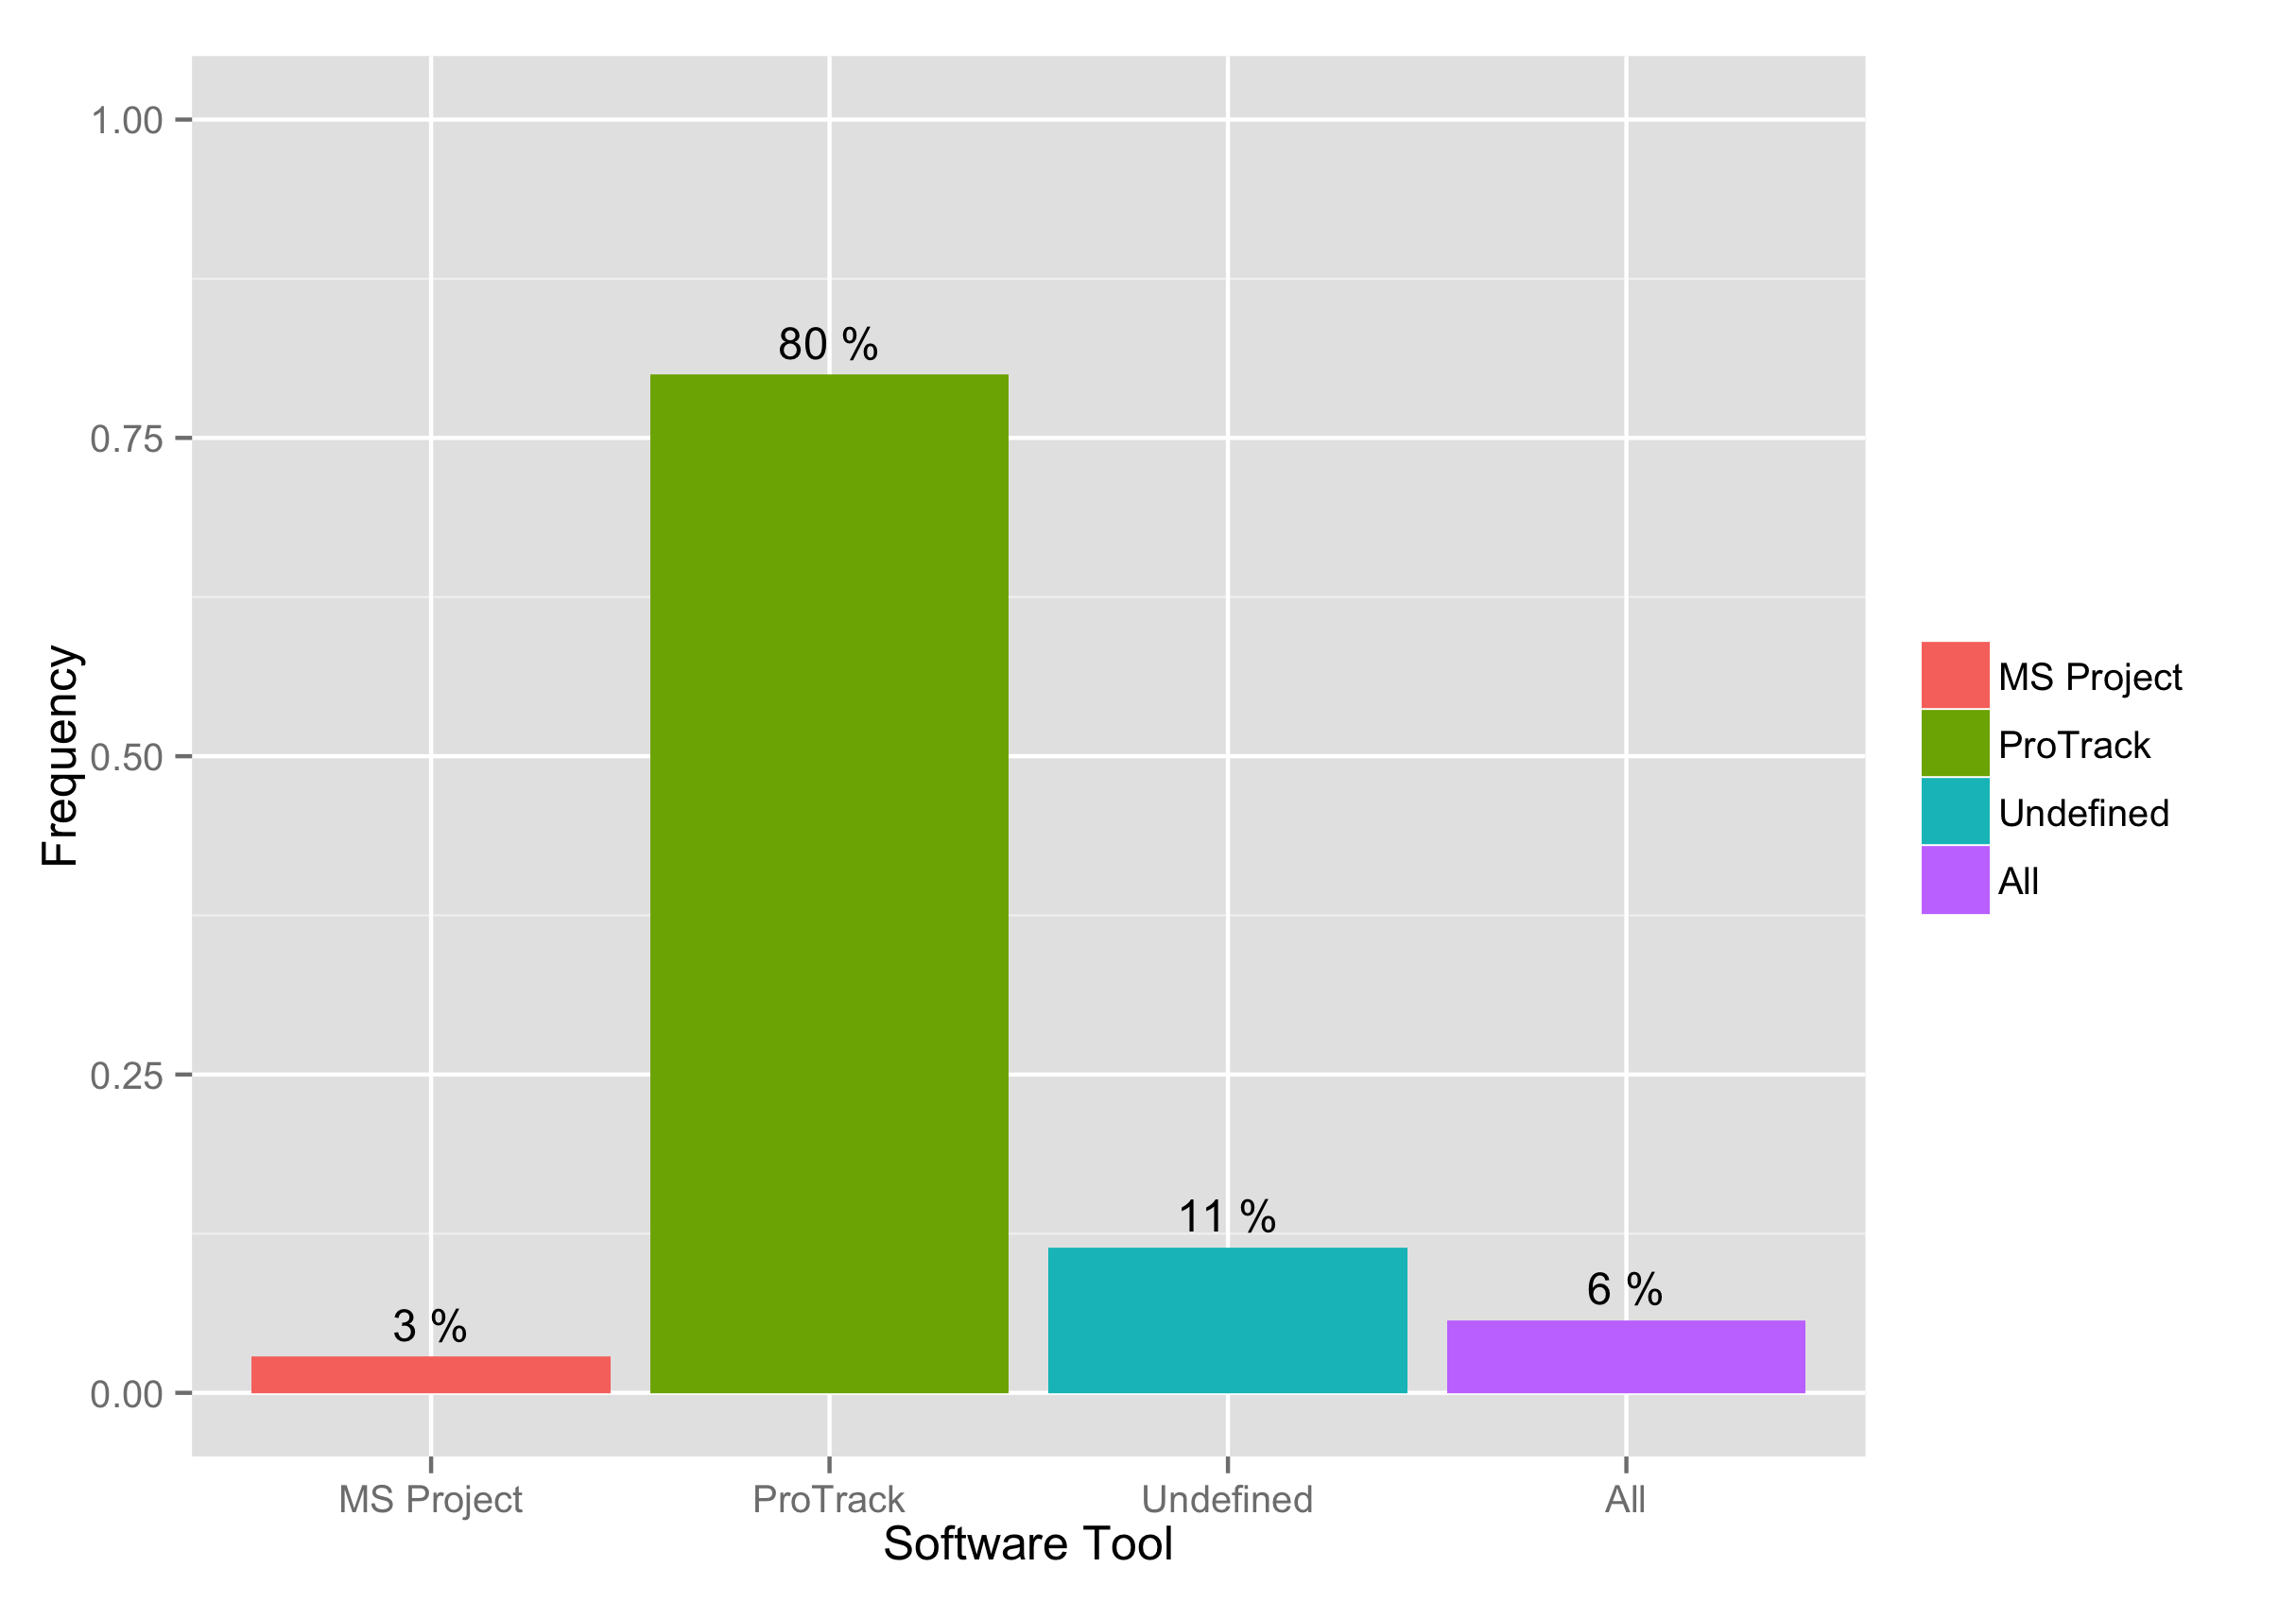
Software use
80% of the students used ProTrack, 3% relied on MS Project and 11% did not specify which software tool they used.
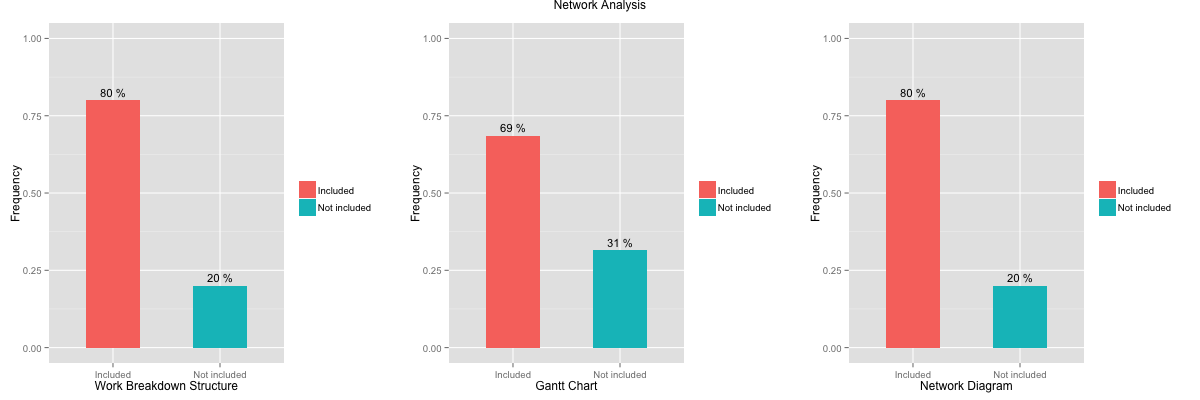
Network analysis
The graph below shows the percentage of students who thought it was relevant to display the work breakdown structure (WBS) and/or the network diagram and Gantt chart.
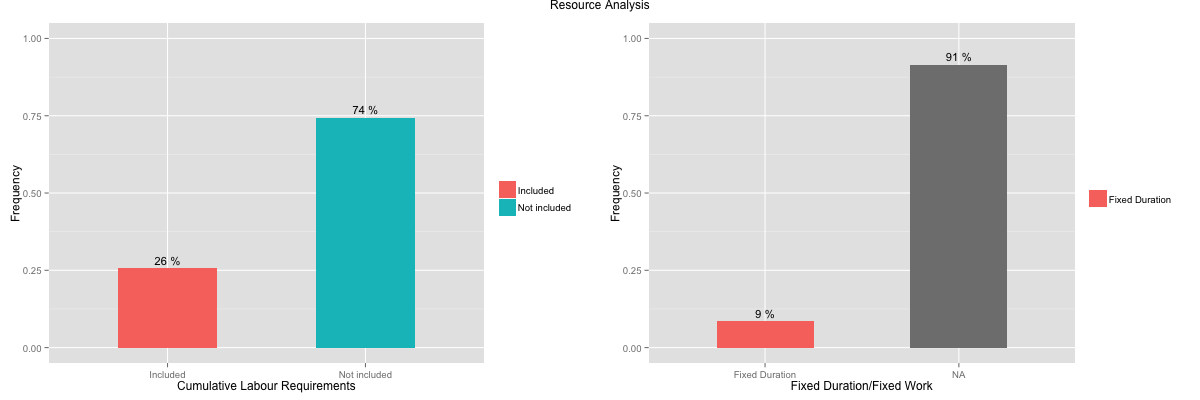
Resource Management
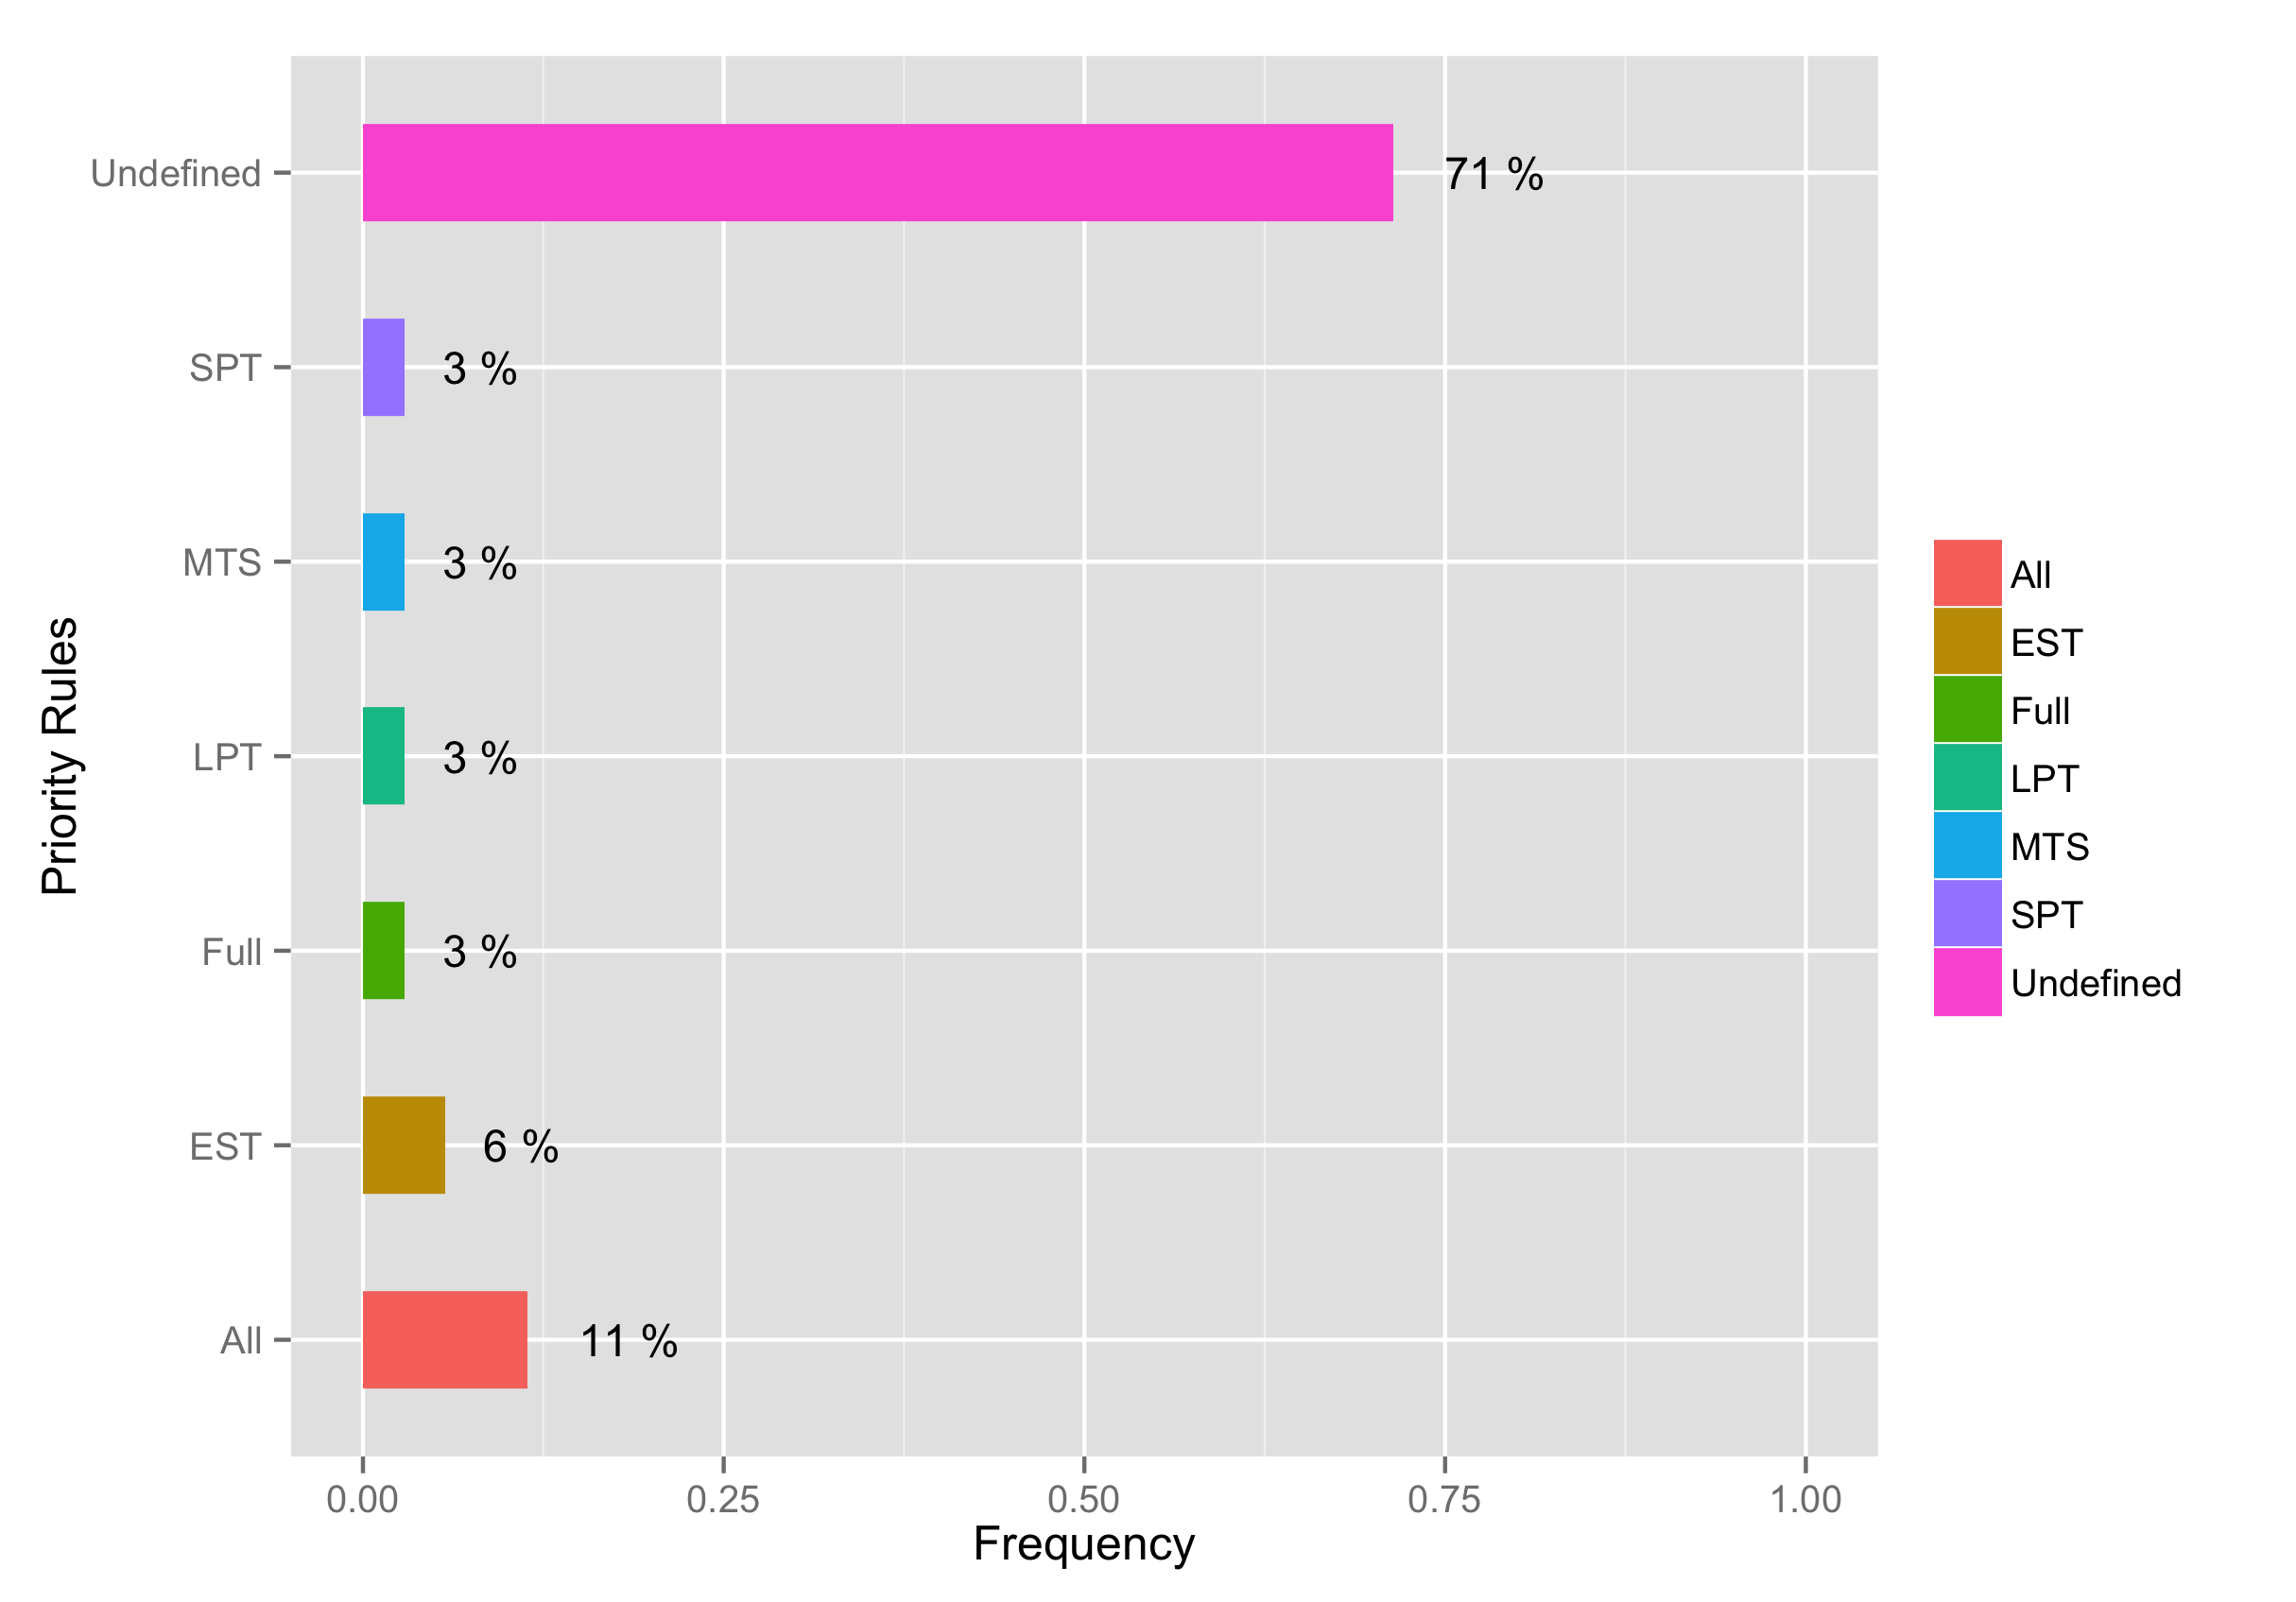
The analysis of the use of resource is done by only 26% of the students by focusing on the cumulative resource requirements. 29% of the students use the resource-constrained project leveling option based on various priority rules (see also the detailed table for the use of these rules). Only 9% of the students mention the use of fixed duration or fixed work activities (or used both), while 91% do not mention any details.

Students who used priority rule based scheduling often do not specify has they have constructed their schedule (78%). A few simply used all the rules available in the software tool (11%). Only a few have chosen to use one of the rules to solve resource over-allocations:
- Shortest Processing Time (SPT)
- Maximum Total Successors (MTS)
- Longest Processing Time (LPT)
- Earliest Start (EST)
- Full optimization (FULL)
More information on the specific details of these rules can be found at PMKC.
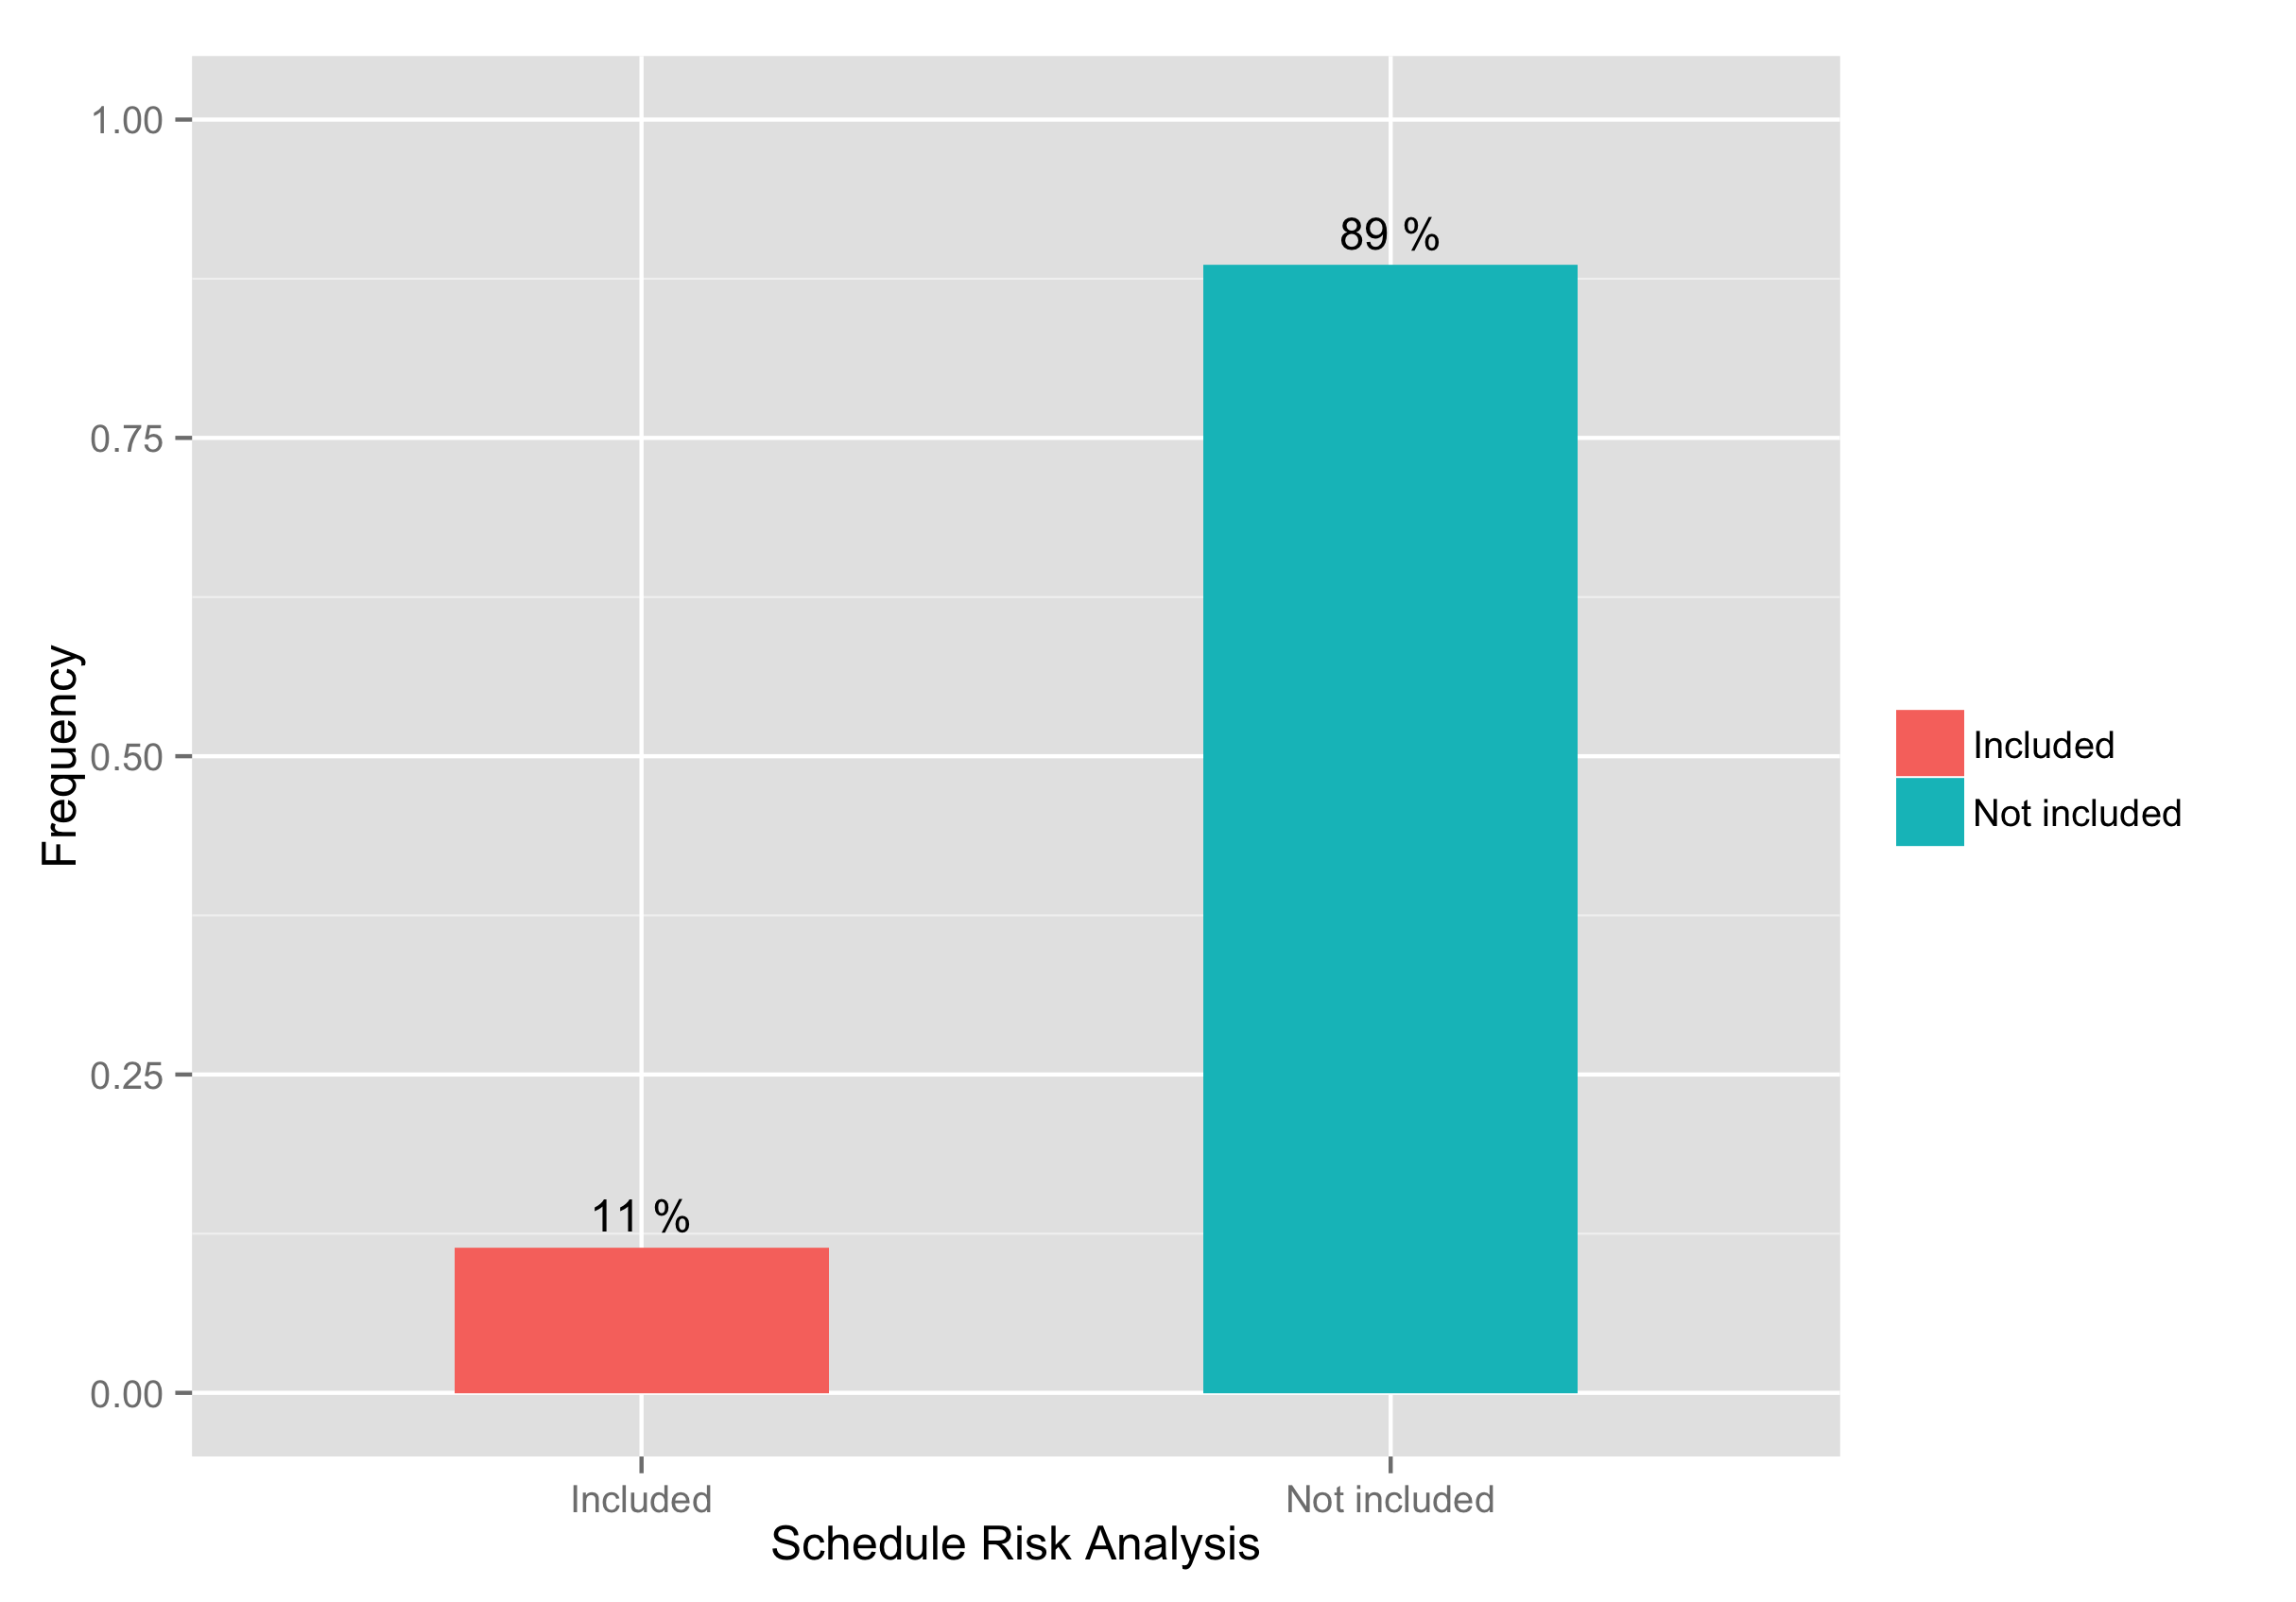
Risk analysis
Only 11% of the students extended their scheduling analysis with schedule risk analysis.
Risk analysis
Analyzing the project data is not a goal on itself, but is a way to be better prepared for the uncertainty that will typify your project once it is in progress. Therefore, any project analysis should be accompanied by proper actions to modify the project characteristics to the wishes and the needs of the company and the project. Actions can consist of adding more resources, changing the network structure with the degrees of freedom, adding costs, shifting resources, and much more. 57% of the students have proposed actions to make their project analysis more realistic. The remaining 43% finished the analysis without extra steps made to find further improvements.
Time is money
Time is often the critical objective when constructing schedules, and therefore, the use of software should focus on this time minimizing target. The summary table below gives some statistics on the final project deadline (compared to the original project deadline of 25/02/2013) using the current set of resources and under the use of extra hired resources (increase and decrease compared to the original deadline is given in days).

Well done!